Currently, I’m involved in a project to develop an event management system for large sports events. The goal is to replace a few existing systems with one integrated system that is able to cater for the coming needs. The project will last for about five years. The project team will grow to approximately 20 persons. We apply an agile unified process.

Part 1: Understanding business is a success factor. We use methods from user centred design rather than from business modeling.
Organizing a large sports event is not a linear process where one can follow a recipe. Certainly, similar things need to be achieved for each event, e.g. athletes’ outfits need to adhere to regulatory standards, winners are announced, prices and awards granted, sites need to be prepared, travel arranged, volunteers recruited and so on. This list actually could continue for another 5000 items. Still, how these things are achieved depends on many factors e.g. the size and importance of the event, the possibilities of the location and the people involved and more. Thus there is not a standardized process, but rather the capability of the expert that know from experience what to do and how to work with each other. These experts use planning tools, checklists, information systems and applications and they are driven by one common goal, to deliver the perfect show to the spectators.

In consequence, we documented how people go at doing their work. The basic methodology for this stems from the field of Human-computer interaction and is called Contextual Inquiry and Design. Our implementation of this method boiled down to going to those preparing the events, observing them, and talking with them about what they do, what is great and what sucks. We also took the opportunity and went on-site to events. We collected documents, excel sheet, took pictures and screenshots of system use, copied forms and faxes. We put the collected information into a set of process maps – these are consolidated sequence models for those familiar with Contextual Design. We are still adding to these maps when we uncover new things.
The process to derive such maps is not too complicated. We started with collecting the knowledge we had in the team on stickies and drew some of them with MS Visio.
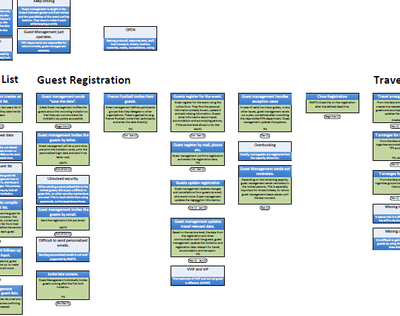
When talking and observing business stakeholders, we again used post-it notes to capture and visualize the many details. All this information was then analyzed and consolidated step by step into process maps. Here is an early stage:
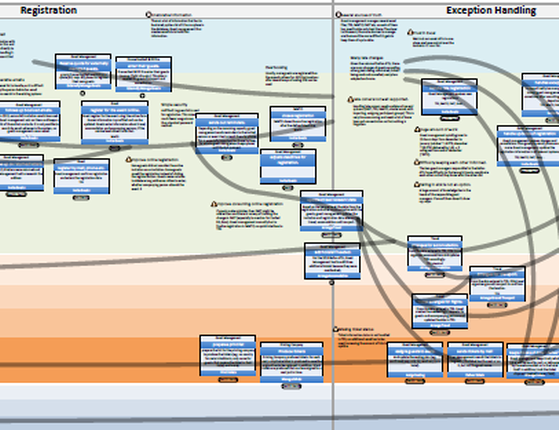
And here a later stage:
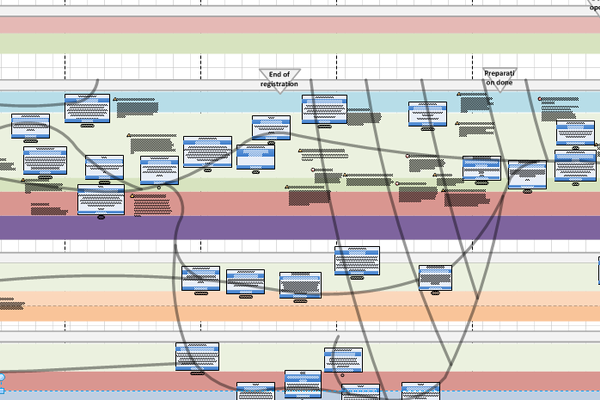
The structure grew while we collected and consolidated the information. Activities and observations form the core of the information. While adding more and more information, swim lanes for the different groups appear and with them the approximate flows. Milestones, stages and deadlines appear later. In the latest form, we also organized the activities per business capabilities in separate streams.
Just a bit about business capability: To enable an organization to award winners is more than just handing over medals. It needs many preparing hands: some to design the medals; some to guard them; some to organize the ceremonies of handing them to the athletes; and so on. The organisation had to learn how to do this well by doing it for several times and optimizing it. So the organisation is skilled in doing this, it is a capability.
Process maps helped us and will still be helpful to us in several ways:
- Details of daily work are shown together with the structure of the work. This form allows capturing, structuring and discussing a lot of information thrown at us on various levels of abstractions in one go. And it is astonishingly fast to do.
- Casting our eyes over these rich models and the collected artifacts, we see how people achieve to run the perfect show, given the challenges and obstacles faced today. We can walk through the model and see the possible system features and improvements we can offer. The artifacts, pictures, and screenshots we collected show what we need to provide in details.
- We have a detailed documentation of how people work, including timing, systems involved and important observations. This allows us to draft a future way of working and evolve this way of working together with our business stakeholders.
Part 2 talks in more details about features and how to manage a project with them.