Currently, I’m involved in a project to develop an event management system for large sports events. The goal is to replace a few existing systems with one integrated system that is able to cater for the coming needs. End of elaboration is closing in and we’re planning for the incremental delivery to follow during construction. Budgeting, estimation and release planning all turn around features (Part 2).

Part 1 discussed understanding business. Here’s a recap:
- Our users are experts driven by the one common goal to deliver the perfect show to the spectators on-site, in front of the TV, and over the internet.
- Each sports event is different and just following a detailed process will not result in the perfect show. Tracking more than 5000 activities, being well prepared and able to react on incidents is what our users need to do.
- Our software is measured on how well it supports this. This is one of the two drivers of the project.
By the end of elaboration, we need to have an overview over the functionality desired by the different stakeholders. The overview is realized with features, i.e. a lump of functionality that somehow belongs together. In it’s simplest form, a feature is a title, a unique number and a user story. Currently, we’re talking about around 300 features for the whole development.
We derived the features from our investigations into the existing system and from the discussions with the business stakeholders. The initial set of features we developed during inception. We just closed the first refinement of the whole feature set during elaboration.
Prioritized features
A necessary step for end of elaboration is to give some priorities to the features with our stakeholders. For this, we use the following sheets:
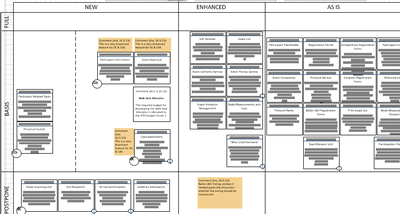
We had one sheet per stakeholder group showing the features they are mainly interested in. To discuss the sheets, we also had wireframes of the UI ready to show our current understanding and ideas. We categorized the features by their newness (as is, enhanced or new) and their importance to business (full, basic, later) and let the stakeholders give feedback and rearrange the features as they felt appropriate.
If you look careful, you can see icons of a star and of clouds on some features. We showed the more immature items to stakeholders and developers. They are difficult to scope and to estimate. Transparency really helps discussion. When talking with stakeholders our explicit message was that for a feature in stars and clouds only basic functionality can be implemented in a first release as business will usually need to learn how to use such a feature before knowing what they actually need to have.
Contradicting project drivers and feature maturity
Our project has two major drivers: replace existing systems and better support for users. Looked at it from technical risk, value and stakeholder acceptance, letting the existing systems live longer is preferable. However from the project sponsoring setup, replacing the old system is what is demanded.
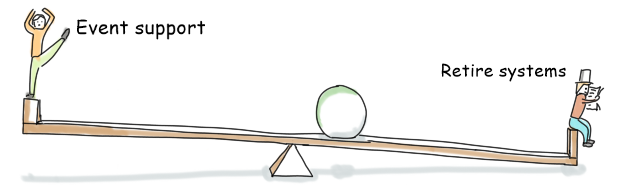
Which of the driver wins when time and money is tight? The conflict is not solved yet and will cause discussions throughout development, that’s for sure. It is certain however that some features are preferred for one of the drivers and others for the other. So choosing one driver over the other will cause a change in what features we have to mature first.
1-pagers as a feature description
The more we elaborate on a feature the more information we gather and need to record. Notes of important details, references to parts of the existing systems, quality requirements and constraints, and more.
We started to briefly describe each feature in what we call a 1-pager. As the name says, it should be something not longer than one page. Everybody loved the concept in theory but it was not adopted. Neither developers, nor architects, nor customers made use of the 1-pagers we have drafted so far and put into our document share. Getting feedback was awfully difficult.
Well, we finally figured out, why the expected success of the 1-pagers did not happen.
We just used the wrong tool.
Let me explain. We use Sparx Enterprise Architect to make sure that the software system we build fits into the overall systems landscape. We model features, connect them with components and data models, we model system interfaces, migration strategies and more. This tool is the repository of the features. The tool is strong for modeling an enterprise system, but weak when it comes to maintaining and summing up numbers as well as when it comes to visualizing. So we export the features to excel and then do some calculations we need for program management. We also use Visio, e.g. for the priorization sheet shown above. Using data graphics in Visio we can easily have a decent visualization of the data in enterprise architect, a working compromise. As for the 1-pagers: we started to write them as separate word documents and stored them in the file system. They are neither connected with our model in EA nor with excel sheets. So nobody really comes across them. Even worse, when we did the estimation, we used word mail merge to generate A6 sized print-outs of our features from the excel sheet. Here are some examples of these print-outs:
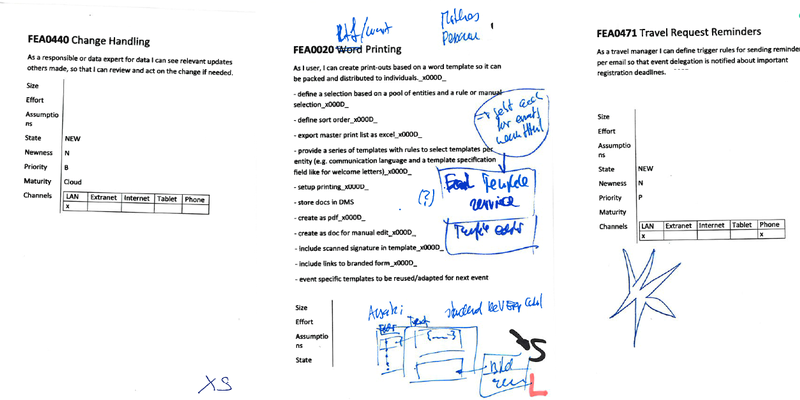
These print-outs were very effective to discuss the requirements of a feature and to spread them on a table to do relative estimation. They just used up a simple one page?!? Well how stupid is that! When printing the sheets from excel, we actually created a second set of 1-pagers!
The simple solution was to just reintegrate the 1-pagers documented in word into excel worksheet and suddenly, it works. Here is our tooling as of now:
- Enterprise Architect is our repository for feature, including details.
- Excel is our front-end on the repository to sum some data for release planning, budget allocation and managing the scope. Import and export between enterprise architect and excel works, well somewhat.
- Visio with its data graphics capability is used for some of visualizations.
- We use the word mail-merge feature to actually create the 1-pagers and print them, e.g. to do estimation.
So the 1-pager finally make it into our communication and we will improve on using them effectively during the coming iteration. E.g. we distributed the whole stack of 1-pagers to one interested stakeholder who wanted to see gaps and overlaps to another projects he is involved in.
But for sure, the 1-pagers have not reached their final stage yet: when we go into construction we think of using user stories for iteration planning and test cases to specify detailed requirements.Thus at one point in time the details about the functionality in the 1-pagers will have completely moved into TFS as stories and test cases and can be generated from there. So will the 1-pagers of the features disappear once the feature is complete?
I’d assume that yes. But it remains to be seen, we’re not there yet. It will give a nice continuation of this article later on.
Estimation and budgeting
We have, just to mention it, more wishes than budget, a typical situation. The approach to allot the budget is however fairly simple: We have features with priorities and cost estimates. We can now simply distribute the available budget over releases. When we will tackle the features to implement we need to strip down the wishes so they match the budget for release. Well at least in theory that works, it will obviously need a way to soothe the tears that have to been wept about functionality that will not make it.
We estimated the features with T-shirt sizes. We calibrated the t-shirt sizes by taking a dozen or so of the features and doing a detailed estimation. The larger features we estimated with two degrees of fulfillment: striped to the bones and gold plated.
Together with some attributes like newness, business priorities and such, the excel sheet for the overall cost calculation looks something like this (please note: the sheet does not show the actual numbers).
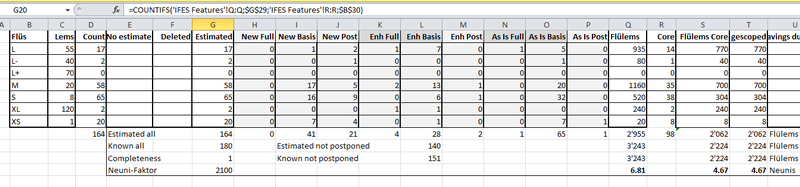
The calculation is fairly simple: we have T-shirt sizes (called Flüs in the spreadsheet) and a calibration value i.e. an indication of the developer effort needed to implement a feature of a specific size (Lems). Counting the items of one size, multiplying the count with the calibration value, and summing it up over all sizes give an indication over the overall effort (Flülems). Obviously we can filter the features to sum up by stakeholder, business scenario, by their importance for business and their newness and thus run several cost scenarios. We can also use the gold-plated or the stripped to the bones t-shirt sizes we estimated for such scenario calculations.
Finally, to translate this into money, we just apply a factor (called Neuni-Faktor) that takes the hourly rate and the cost of the supporting activities like project management, system and acceptance testing, requirements engineering, release roll-out etc. into account. From this we receive our project currency (called Neuni). The exchange rate of Neunis to Swiss Francs is assumed to be 1:1, but we will see how this exchange rate evolves over time.
Features at the heart of the interlocked cycles pattern
We use features to synchronize two closed loop systems: the overall project loop and the loops of the releases. Our estimated and prioritized features allow us to budget and scope the overall project. When breaking up the project into several smaller releases, the features allow to budget and scope the release.
We plan to build up the functionality by business scenario, i.e. a specific end-to-end process of our users. Thus each release will address a set of business scenarios. As we can assign features to these scenarios, we can assign a budget to the release. Project planning and scoping now has to ensure that all business scenarios get supported. The degree of support is however defined in detail once the release will be built and the budget has been assigned. The only thing we need to do is to time- and money-box each of the releases. All such things call for an agile method like Scrum to manage the releases.
Some lessons learned so far
Features so far proved a good tool:
- Features are quite easy to spot and describe. The user story template we used helps to focus on the key aspects we need to record and works quite well for communicating the scope to stakeholders.
- Features are an easy tool for roadmapping and prioritizing.
- The lump of functionality our features represent integrate nicely with our usage scenarios and the UI prototpying. Instead of the generalized description of user-system interaction provided by use cases, we have concrete scenarios of the future work to describe the dynamics and a wireframes to show the details. Features just show the extract we need to record for scoping discussions.
- Features can be easily broken down into user stories that will populate our development backlog. This approach better fits the more agile construction phase we have in mind than use cases.
- People have little expectations on the formal aspects of features – unlike e.g. use cases, user stories, epics, requirements. This reduces the amount of useless discussion about the right way of doing something and gives room to fruitful discussions about what we actually need to do.
Part three talks about how to build the features while starting with the essentials.